
Visualize the execution of firmware inputs to quickly pinpoint the root cause of defects or performance bottlenecks that limit your coverage.
1. Flame Graphs for Interesting Inputs
In the Run View, navigate to the Interesting Inputs section. These inputs are flagged because they lead to new code coverage in your firmware.
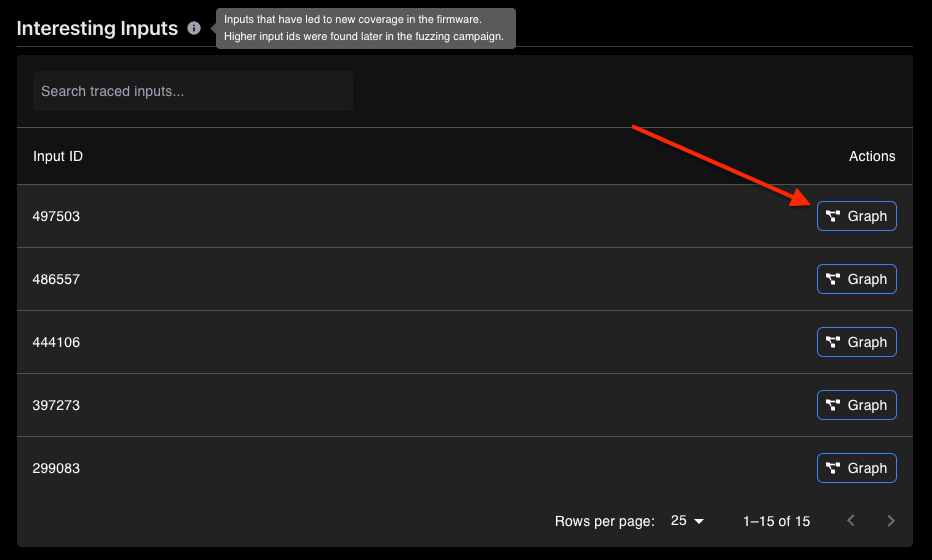
An “interesting input” is one that triggers previously unseen code paths or uncovers defects. These are sorted by descending Input ID, where higher Input IDs are found later in the fuzzing campaign.
Clicking the Graph button next to an interesting input opens a new window where the execution is rendered as a flame graph. This visualization allows you to see which functions or code regions consume the most resources, helping you understand what led to a defect or why the firmware is bottlenecked.
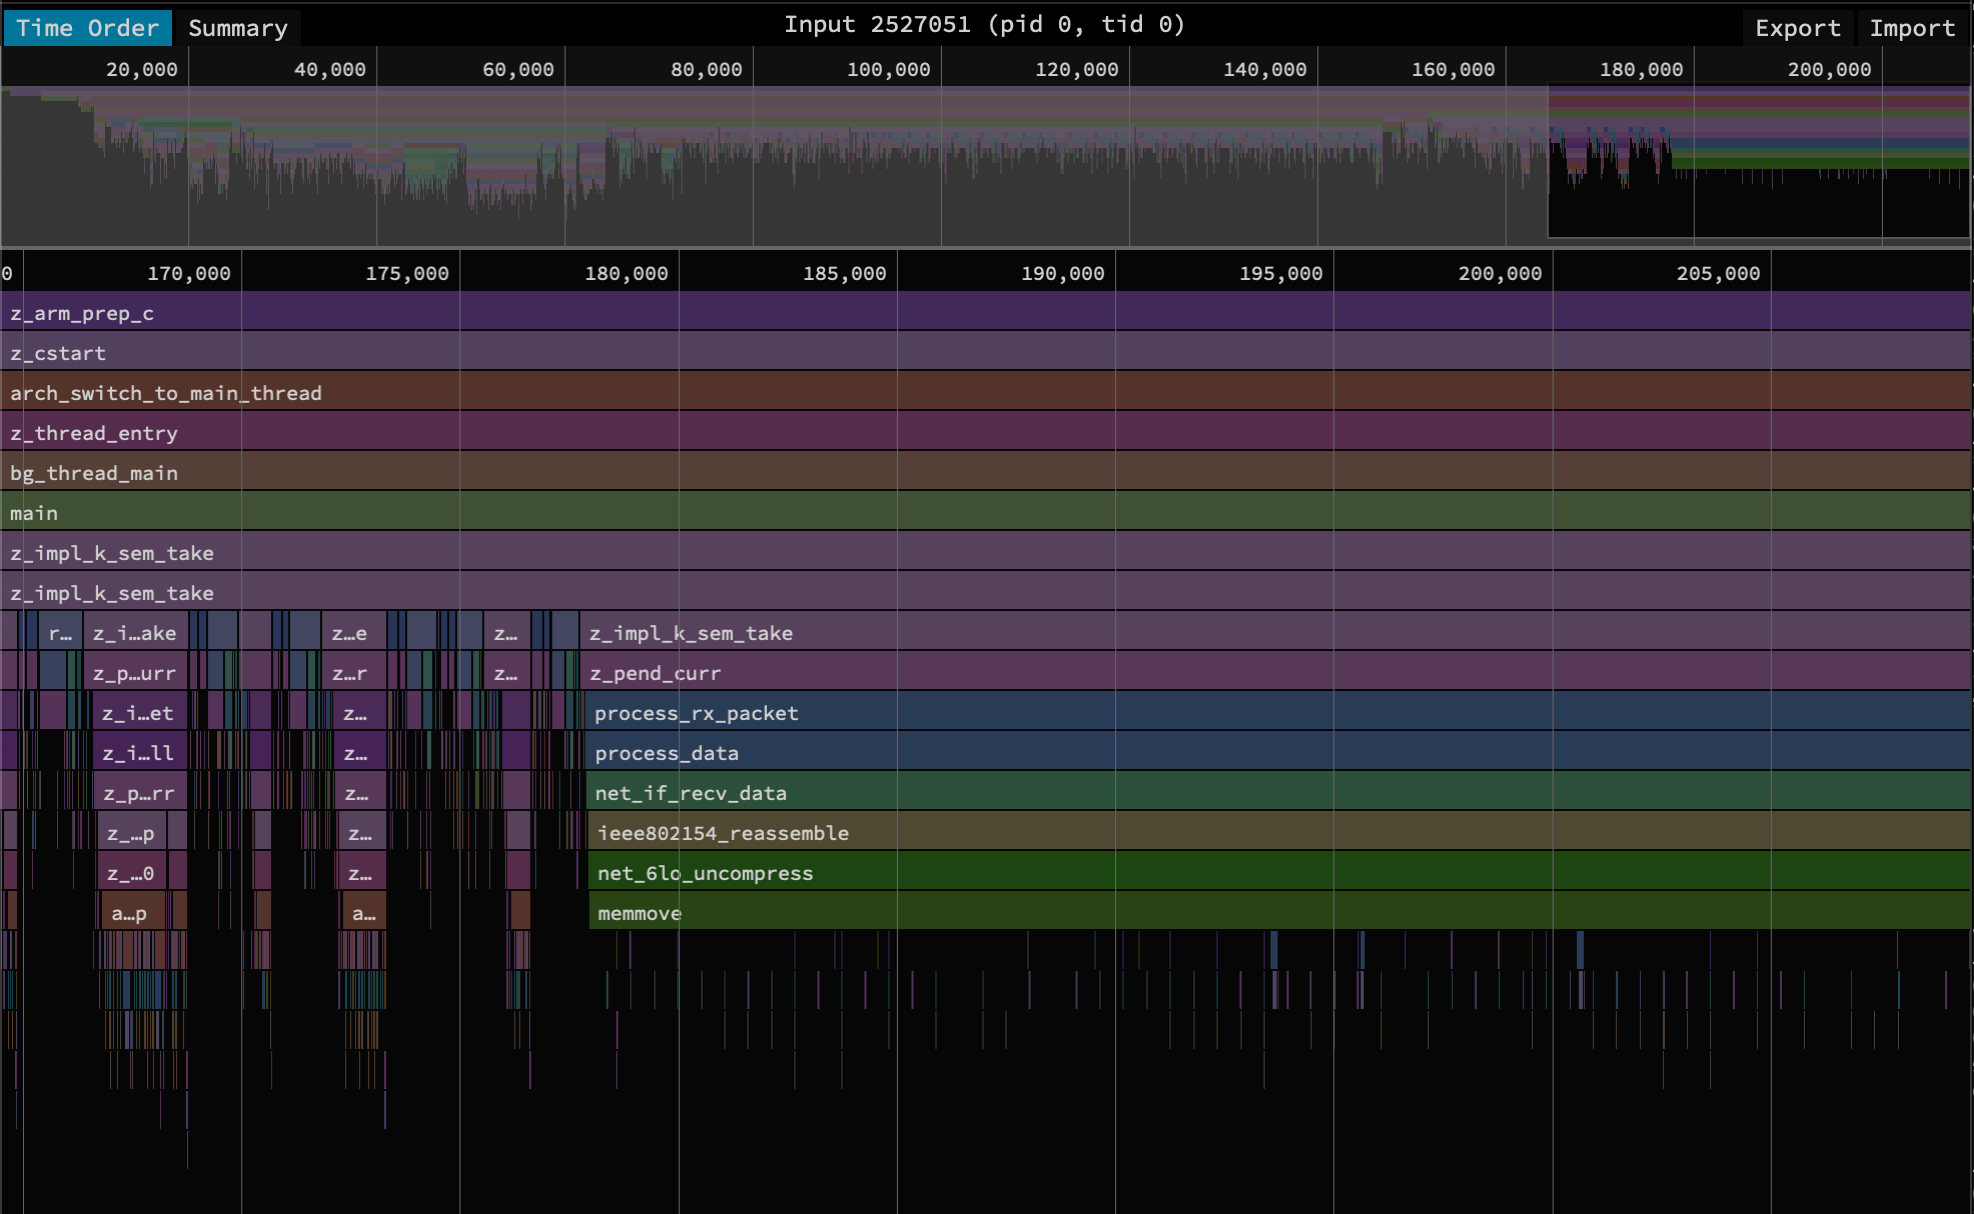
The measurement unit used by the graph is a variant of the basic block, but you can think of it as units of computation or time.
2. Flame Graphs for Defects
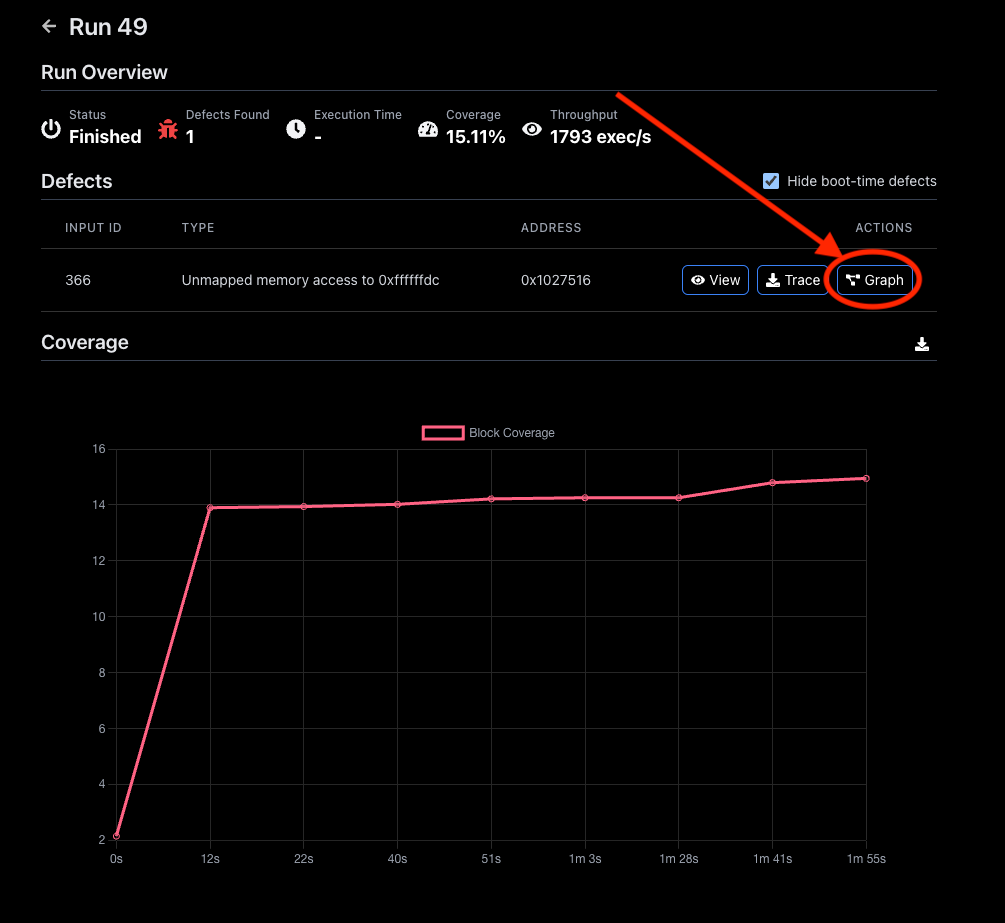
Alternatively, you can graph the execution of a specific defect directly from the Defects section. This feature lets you drill down into the execution path that caused the defect, making it easier to diagnose and address the issue.
Use these flame graphs as a powerful tool to optimize your firmware's performance and increase your testing coverage.