Metalware automatically identifies and records crashes during each fuzzing run.
Each crash is classified and can be further examined by clicking
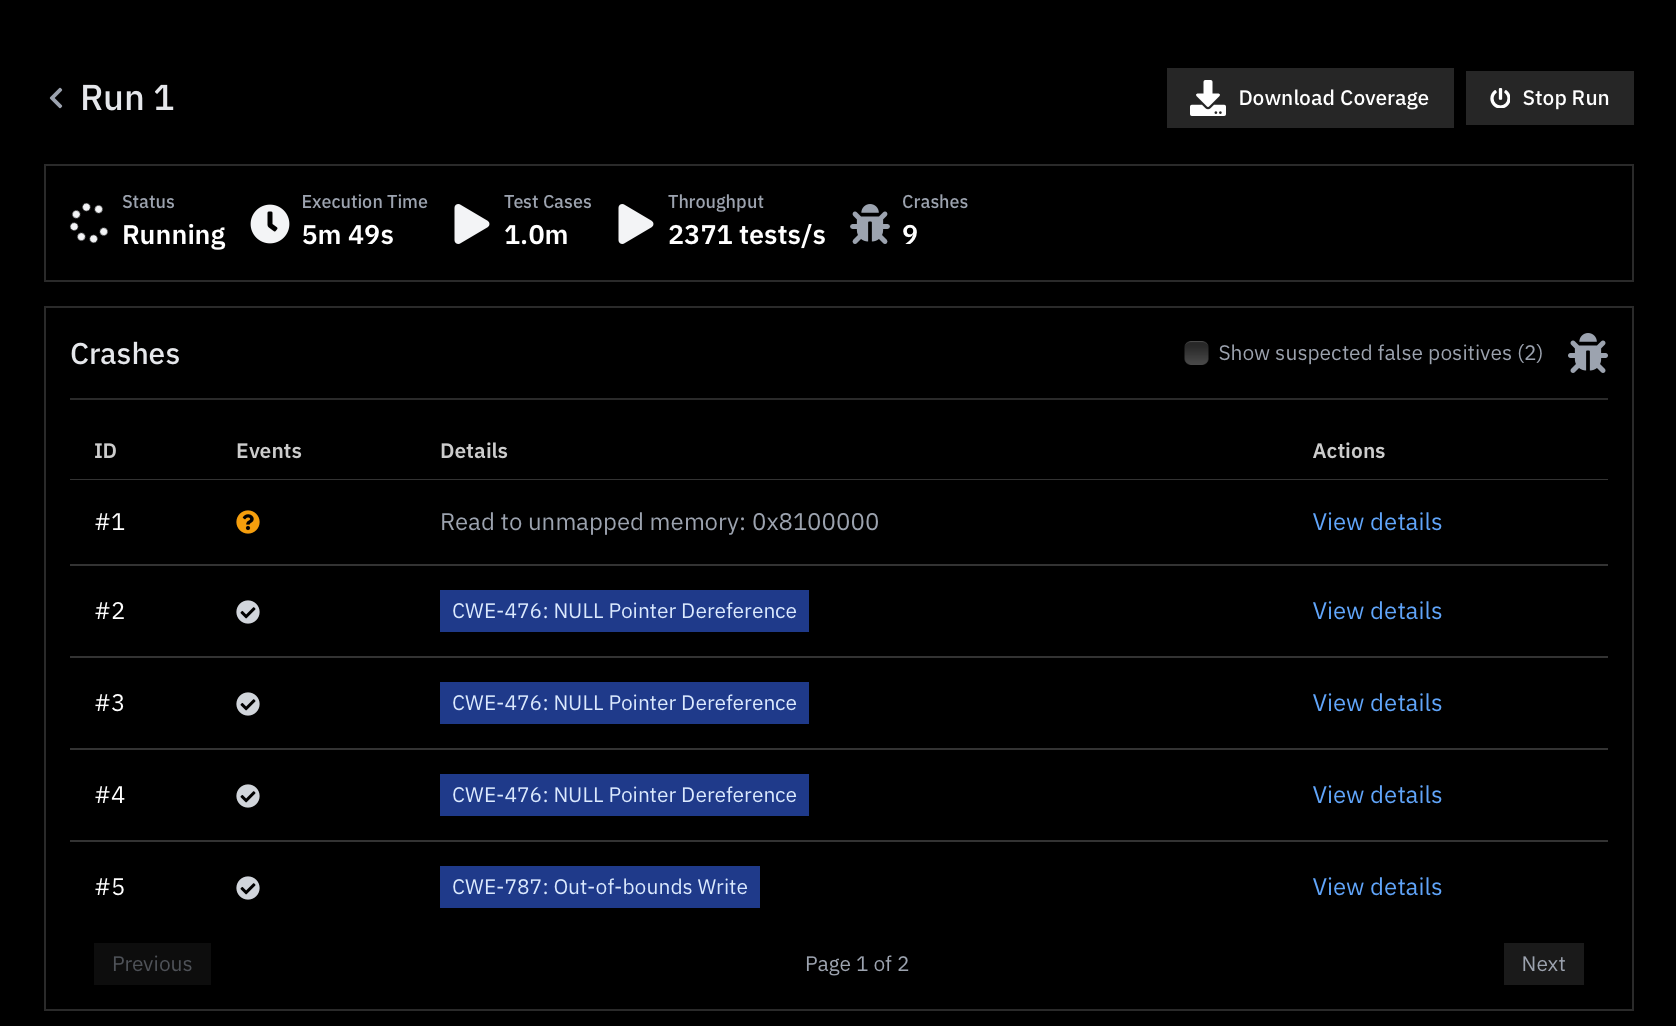
View Details.1. Viewing Crashes
Crashes show up at the top of the Run Page:
Key Features:
- Automatic Classification:
Havoc attempts to automatically classify each crash based on a program trace produced when the respective test case is executed.
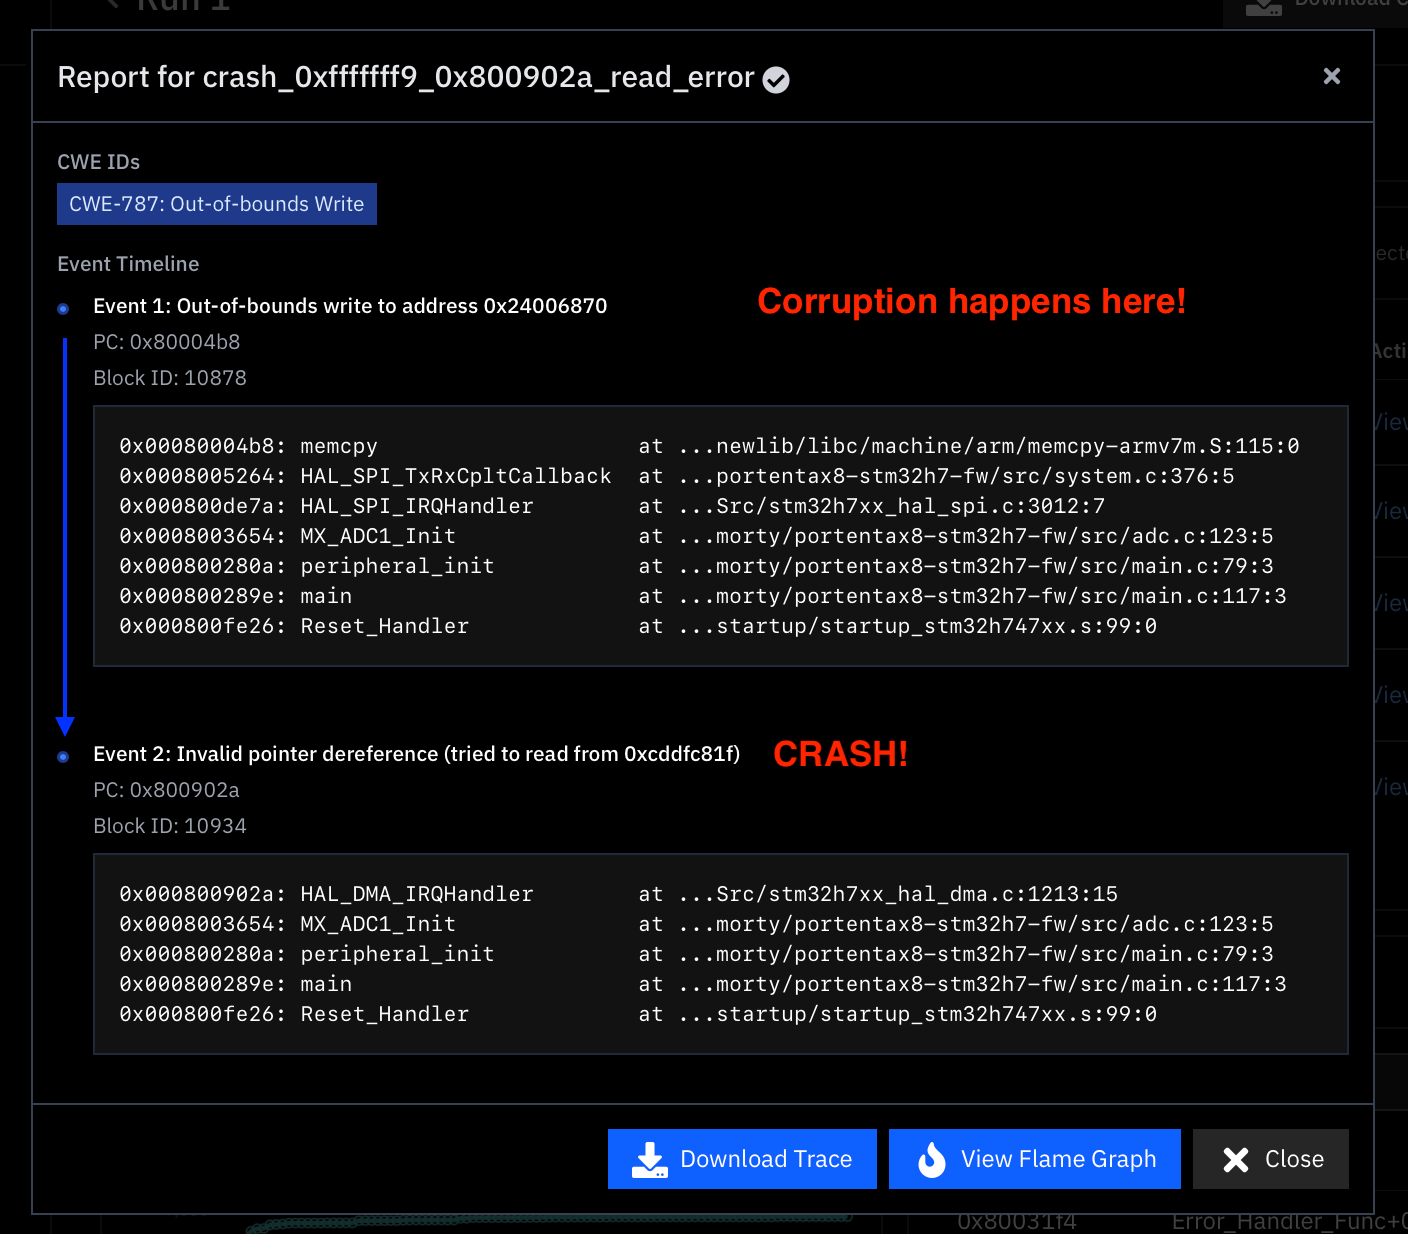
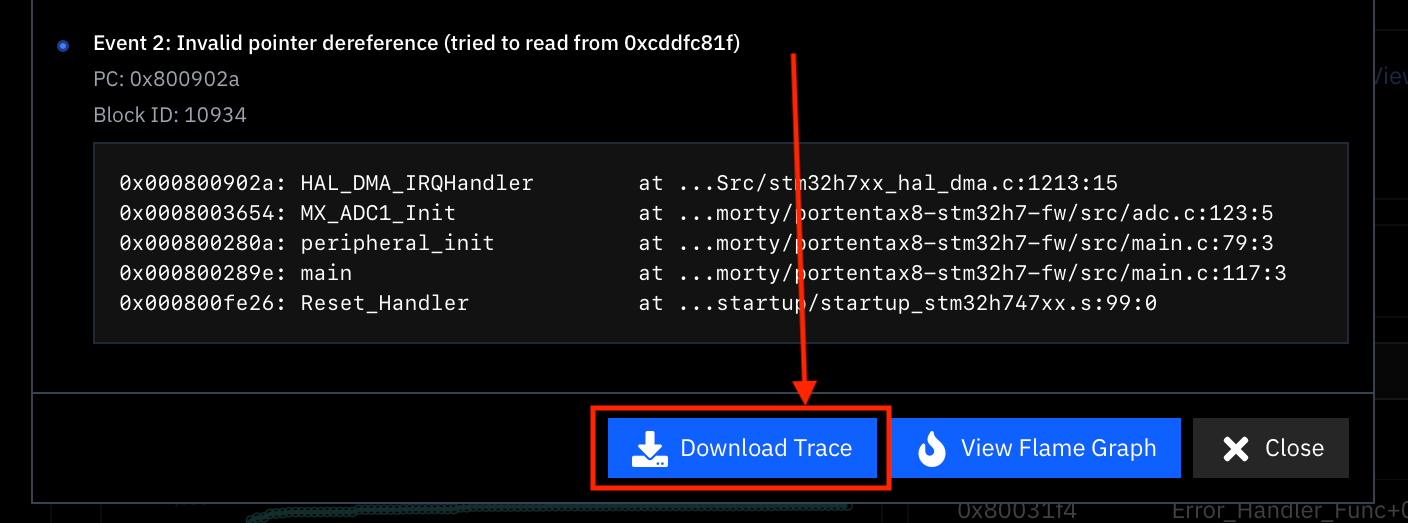
- Chronological Stack Traces:
For every crash, Havoc displays a chronological series of events with corresponding stack traces that led to the crash. This detailed view helps you understand the sequence of operations that triggered the issue.
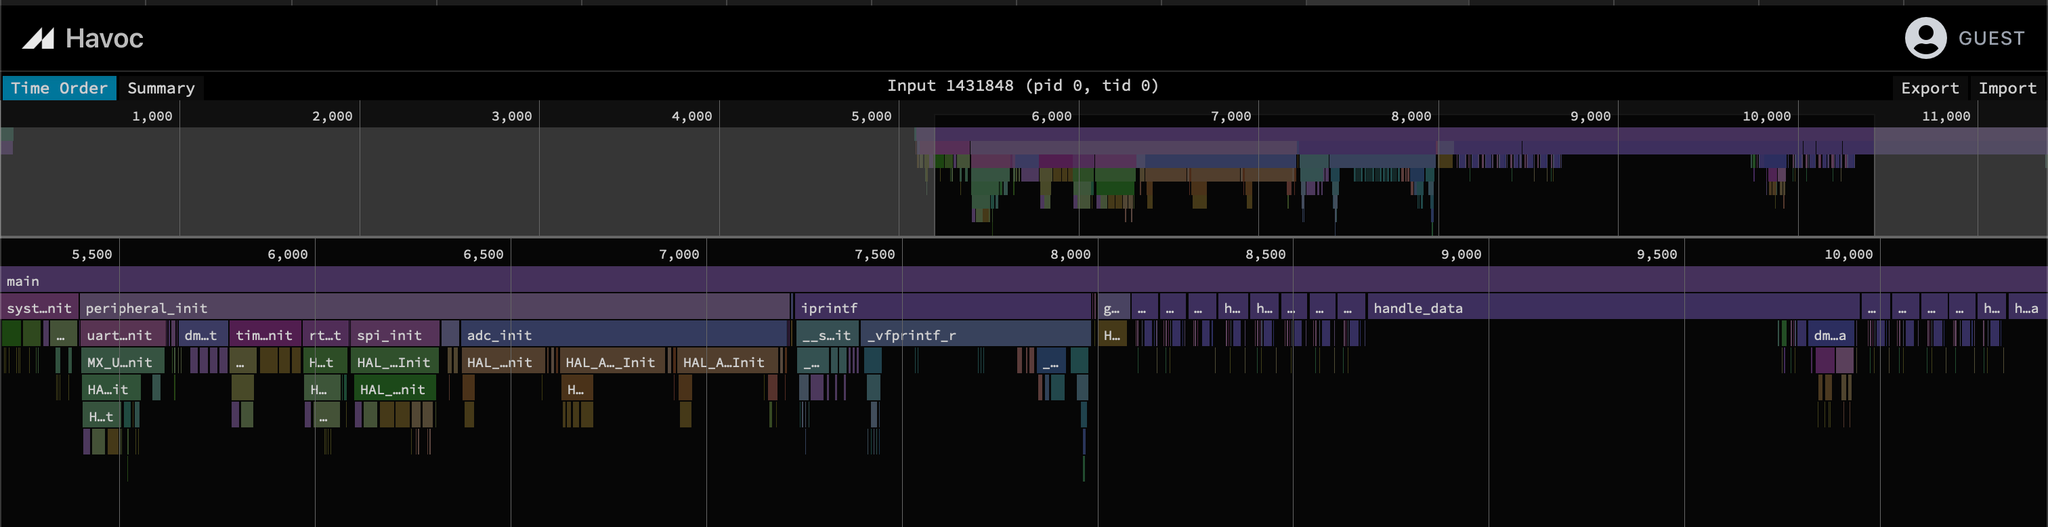
2. Graphing a crash
You can graph the execution of the input that led to the defect by selecting  Visualizing Test Cases.
View Flame Graph. For more details see 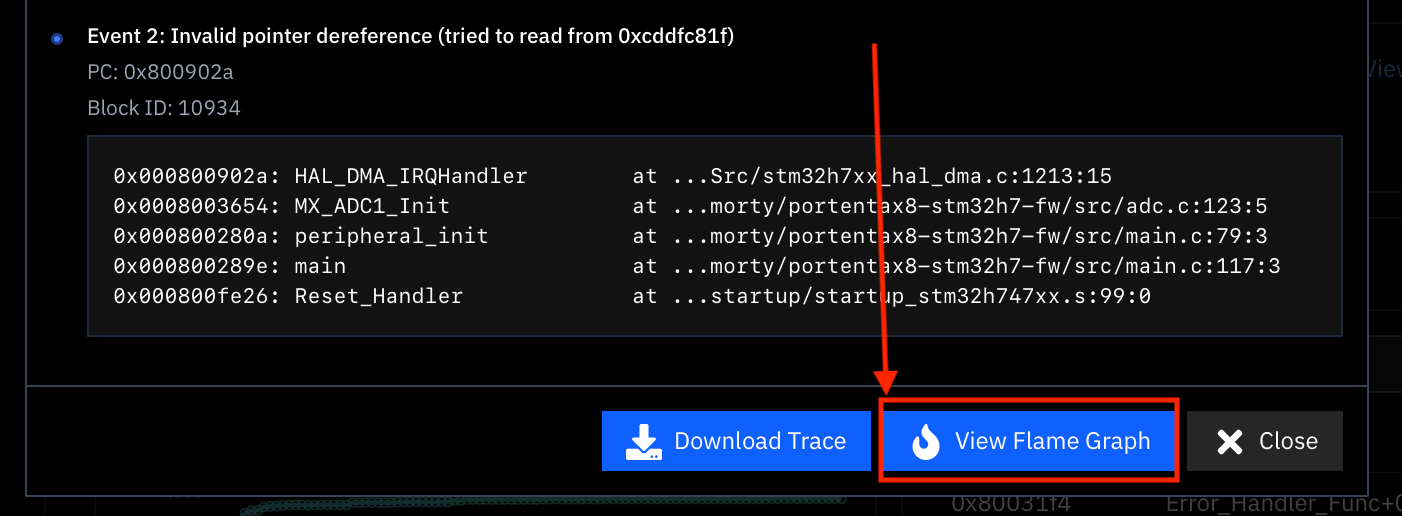
3. Downloading the Program Trace
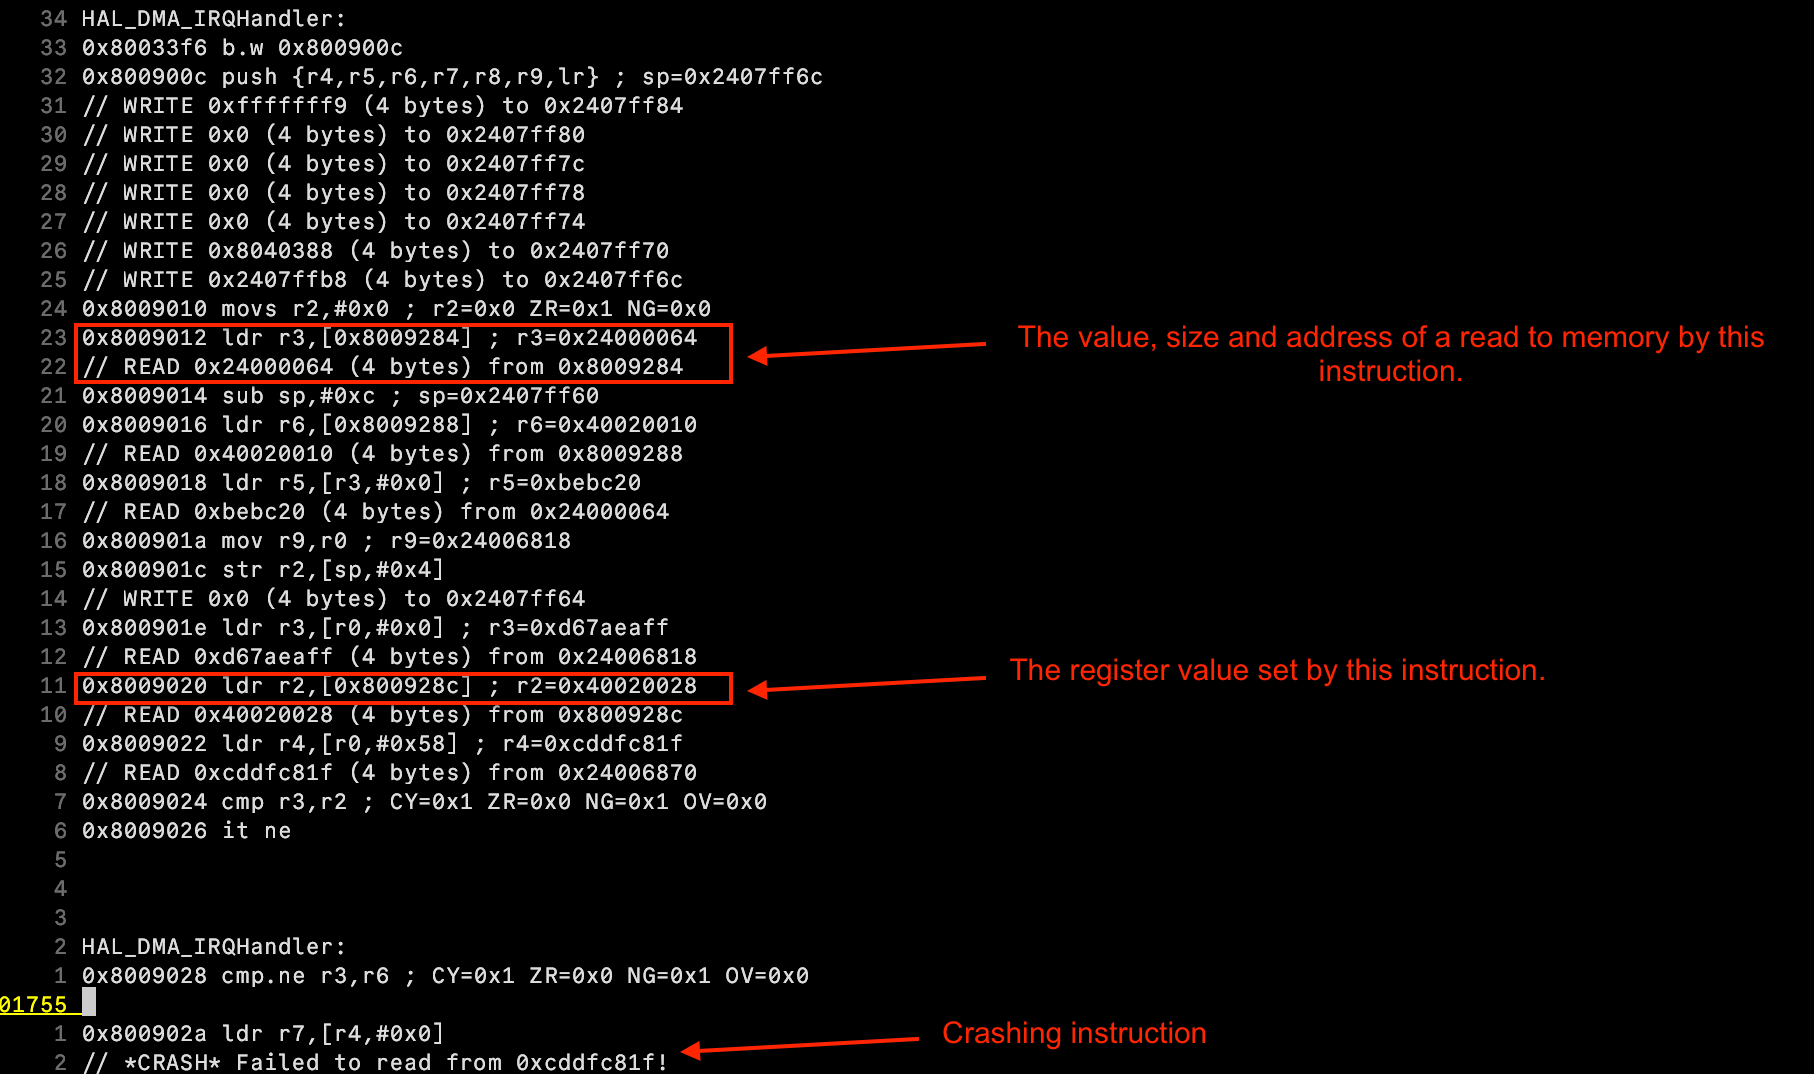
For a deeper analysis, you can download a complete program trace by selecting the Trace option:
A trace provides a unified, detailed view of everything that occurred during the program execution, including:
- Instruction Flow:
A sequential listing of executed instructions, organized into functions and basic blocks.
- Register Activity:
Information on which registers are written to at each instruction.
- Memory Operations:
Detailed records of memory reads and writes associated with each instruction.
Why Use a Trace?
A complete program trace is invaluable for in-depth analysis, helping you pinpoint why a defect occurred and enabling you to trace the exact sequence of operations that led to a failure.