After creating your project, you’re ready to begin the fuzzing run. Follow the steps below to start and monitor the fuzzing process.
1. Create run
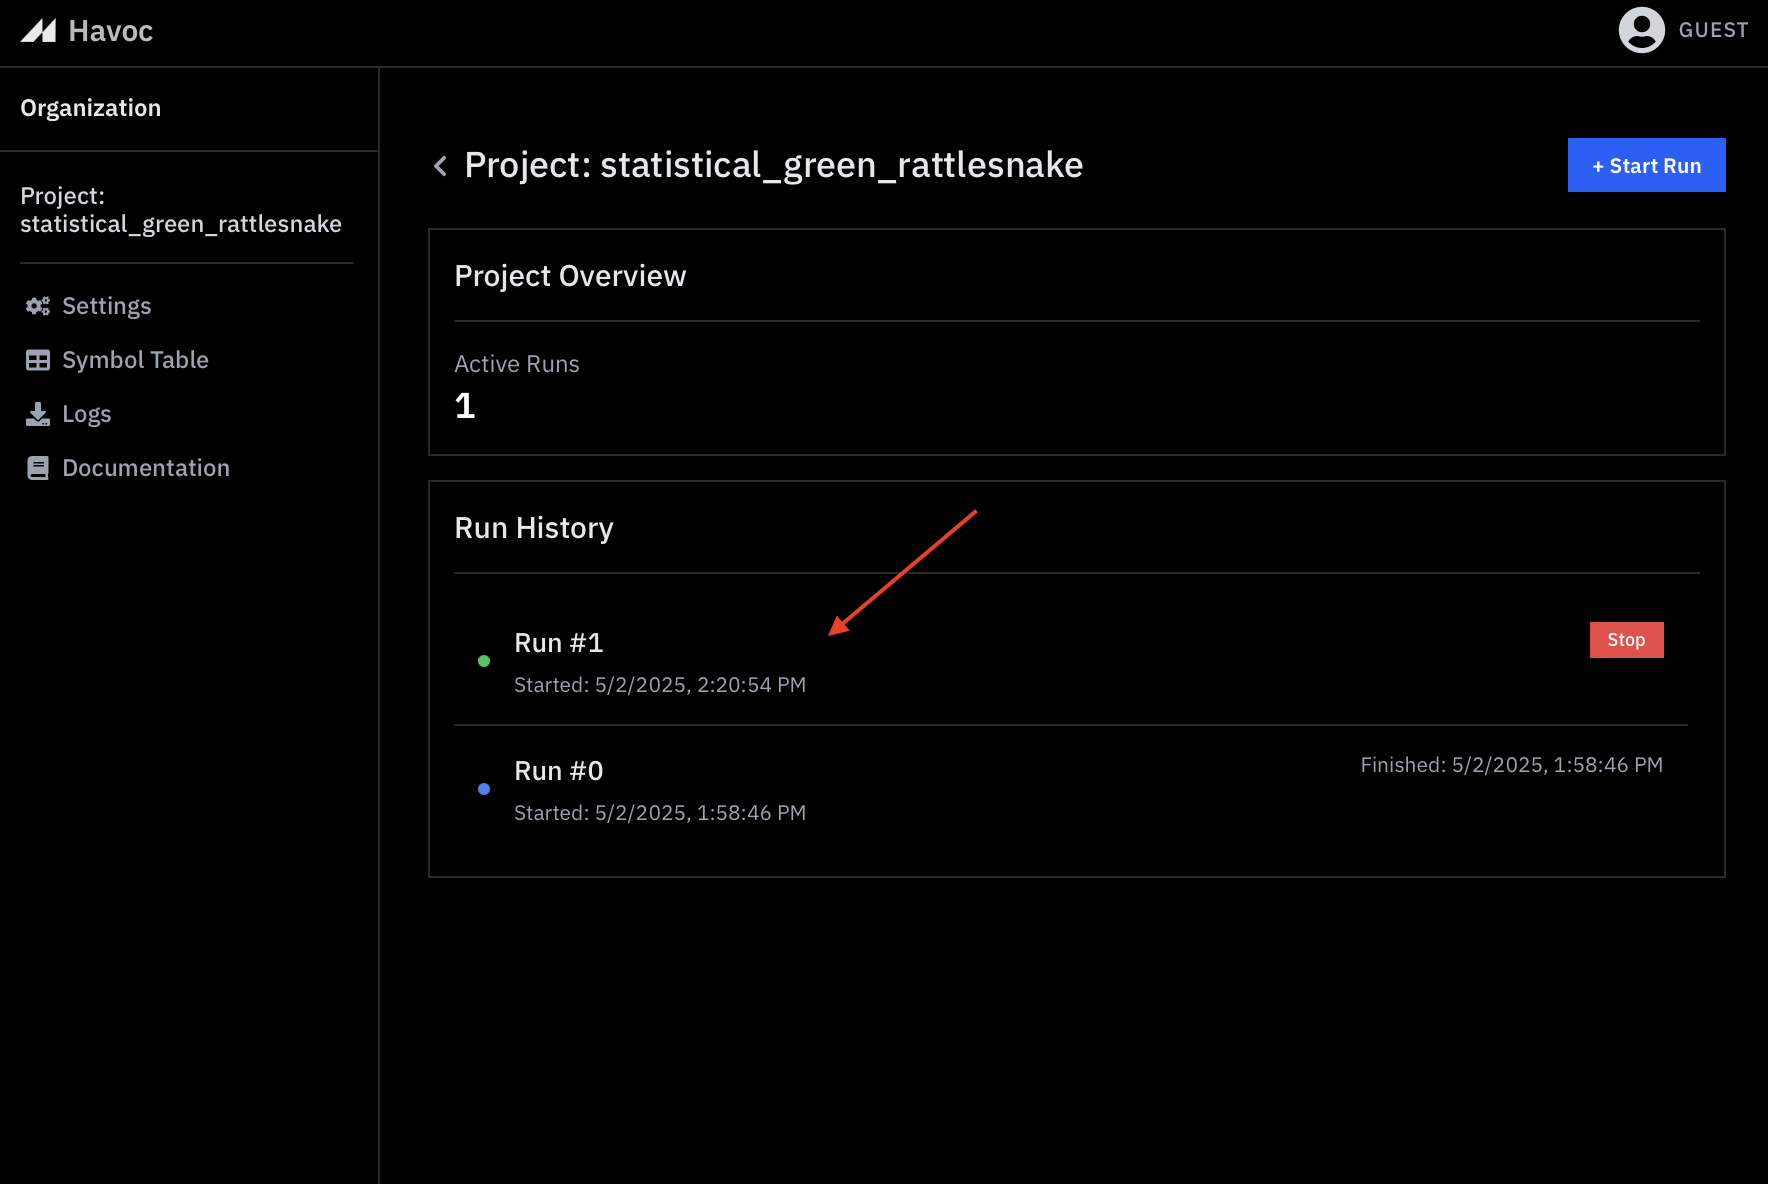
Return to the Home Screen and select your project:
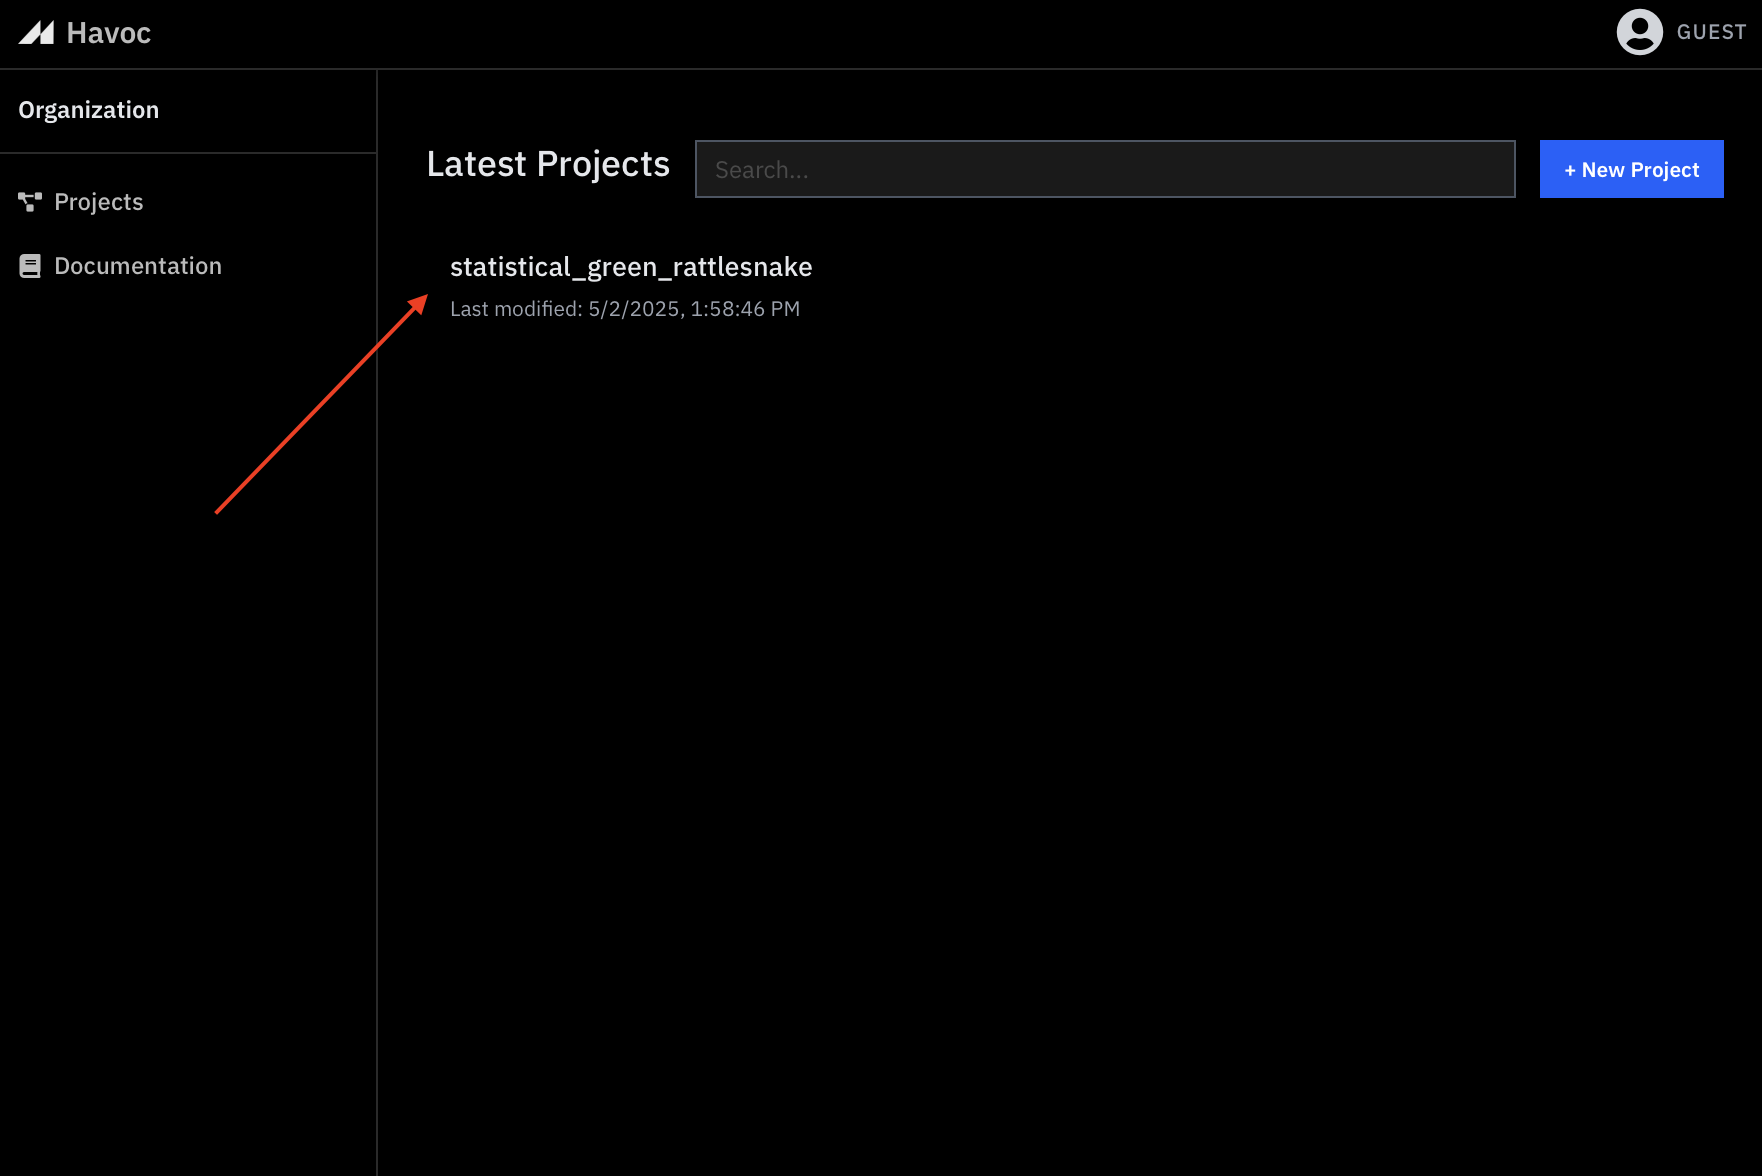
On the Project Page, select
Start Run :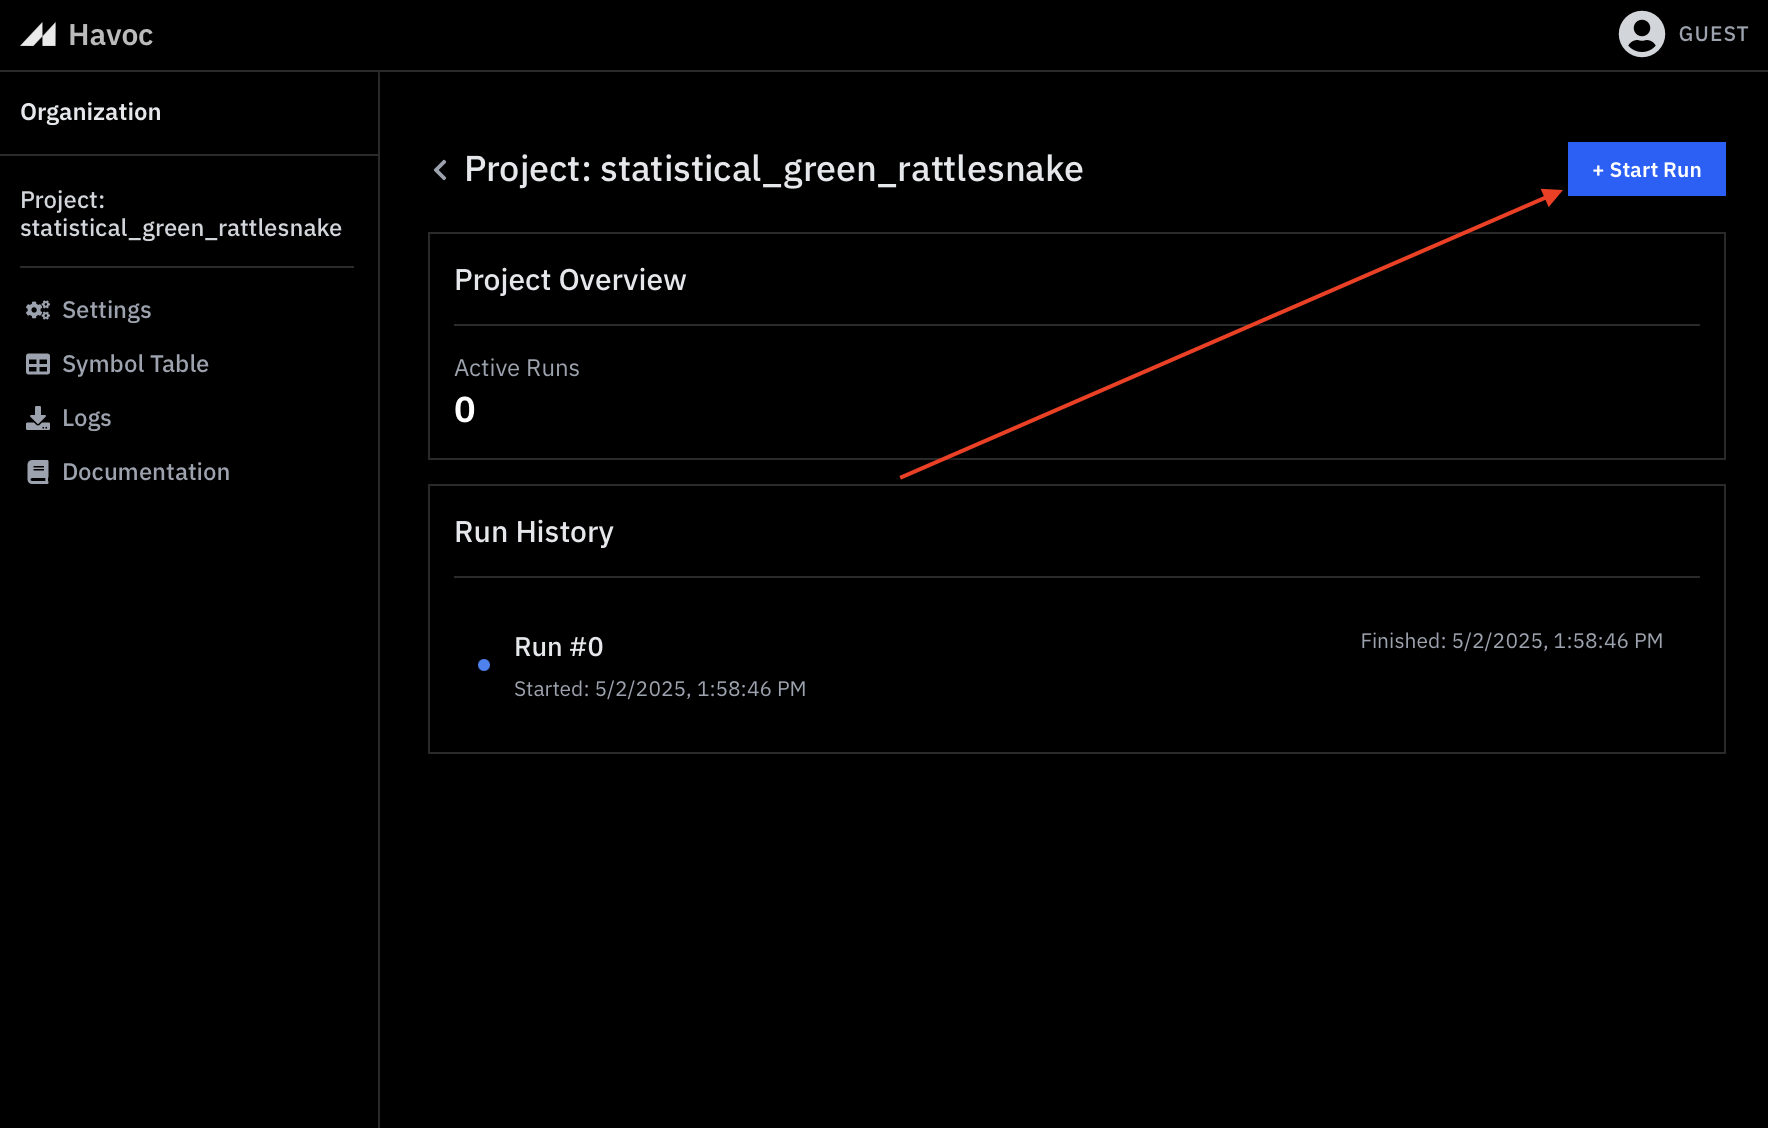
2. Set Instance Count
You will prompted to select the number of cores to run the fuzzer on:
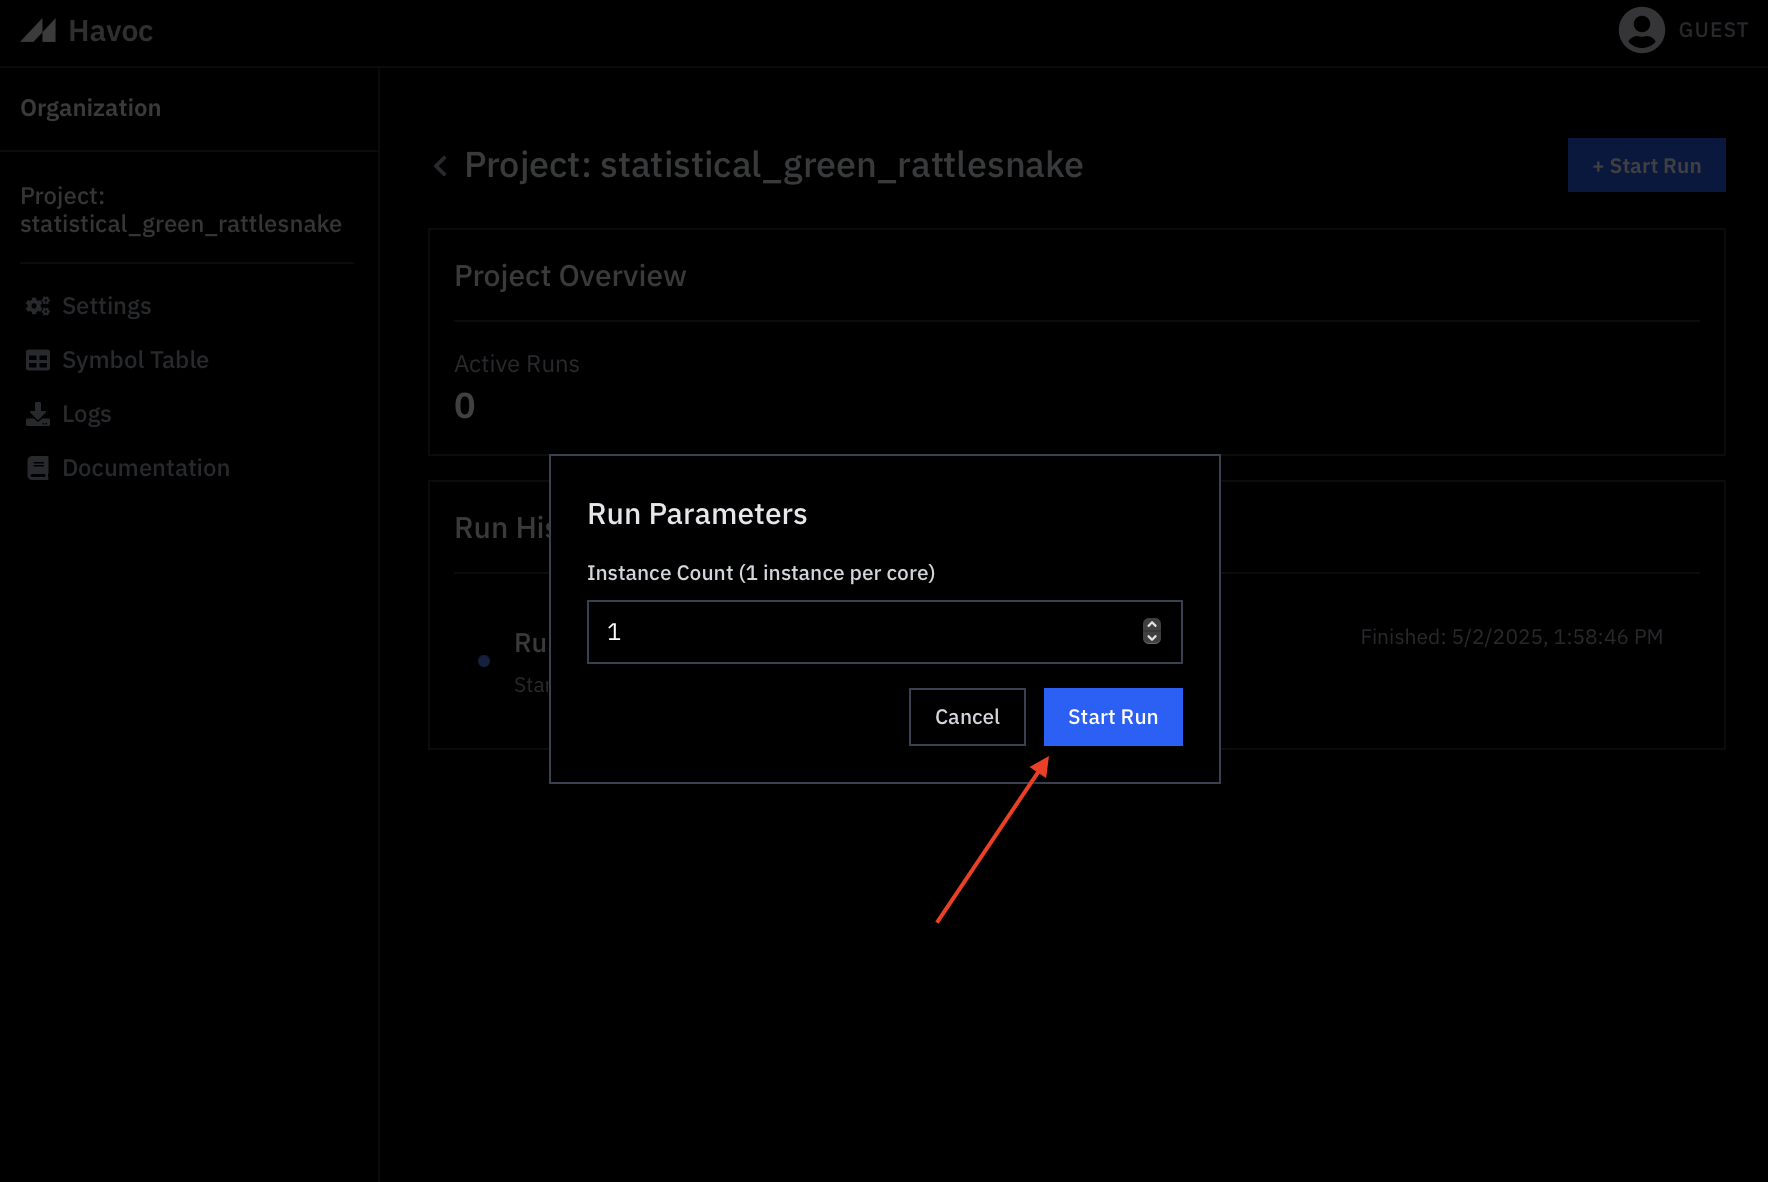
We recommend you start small with 1 instance (1 core) and scale once you are confident in the configuration of your project. Each instance (core) requires ~5GB RAM.
The tool is capable of multi-core fuzzing with intelligent knowledge sharing across fuzzing instances. Individual instances avoid duplicating work that has been performed by other instances.
Within a few moments, your fuzzing run will appear in the project’s run list:
3. Monitor the Fuzzing Process
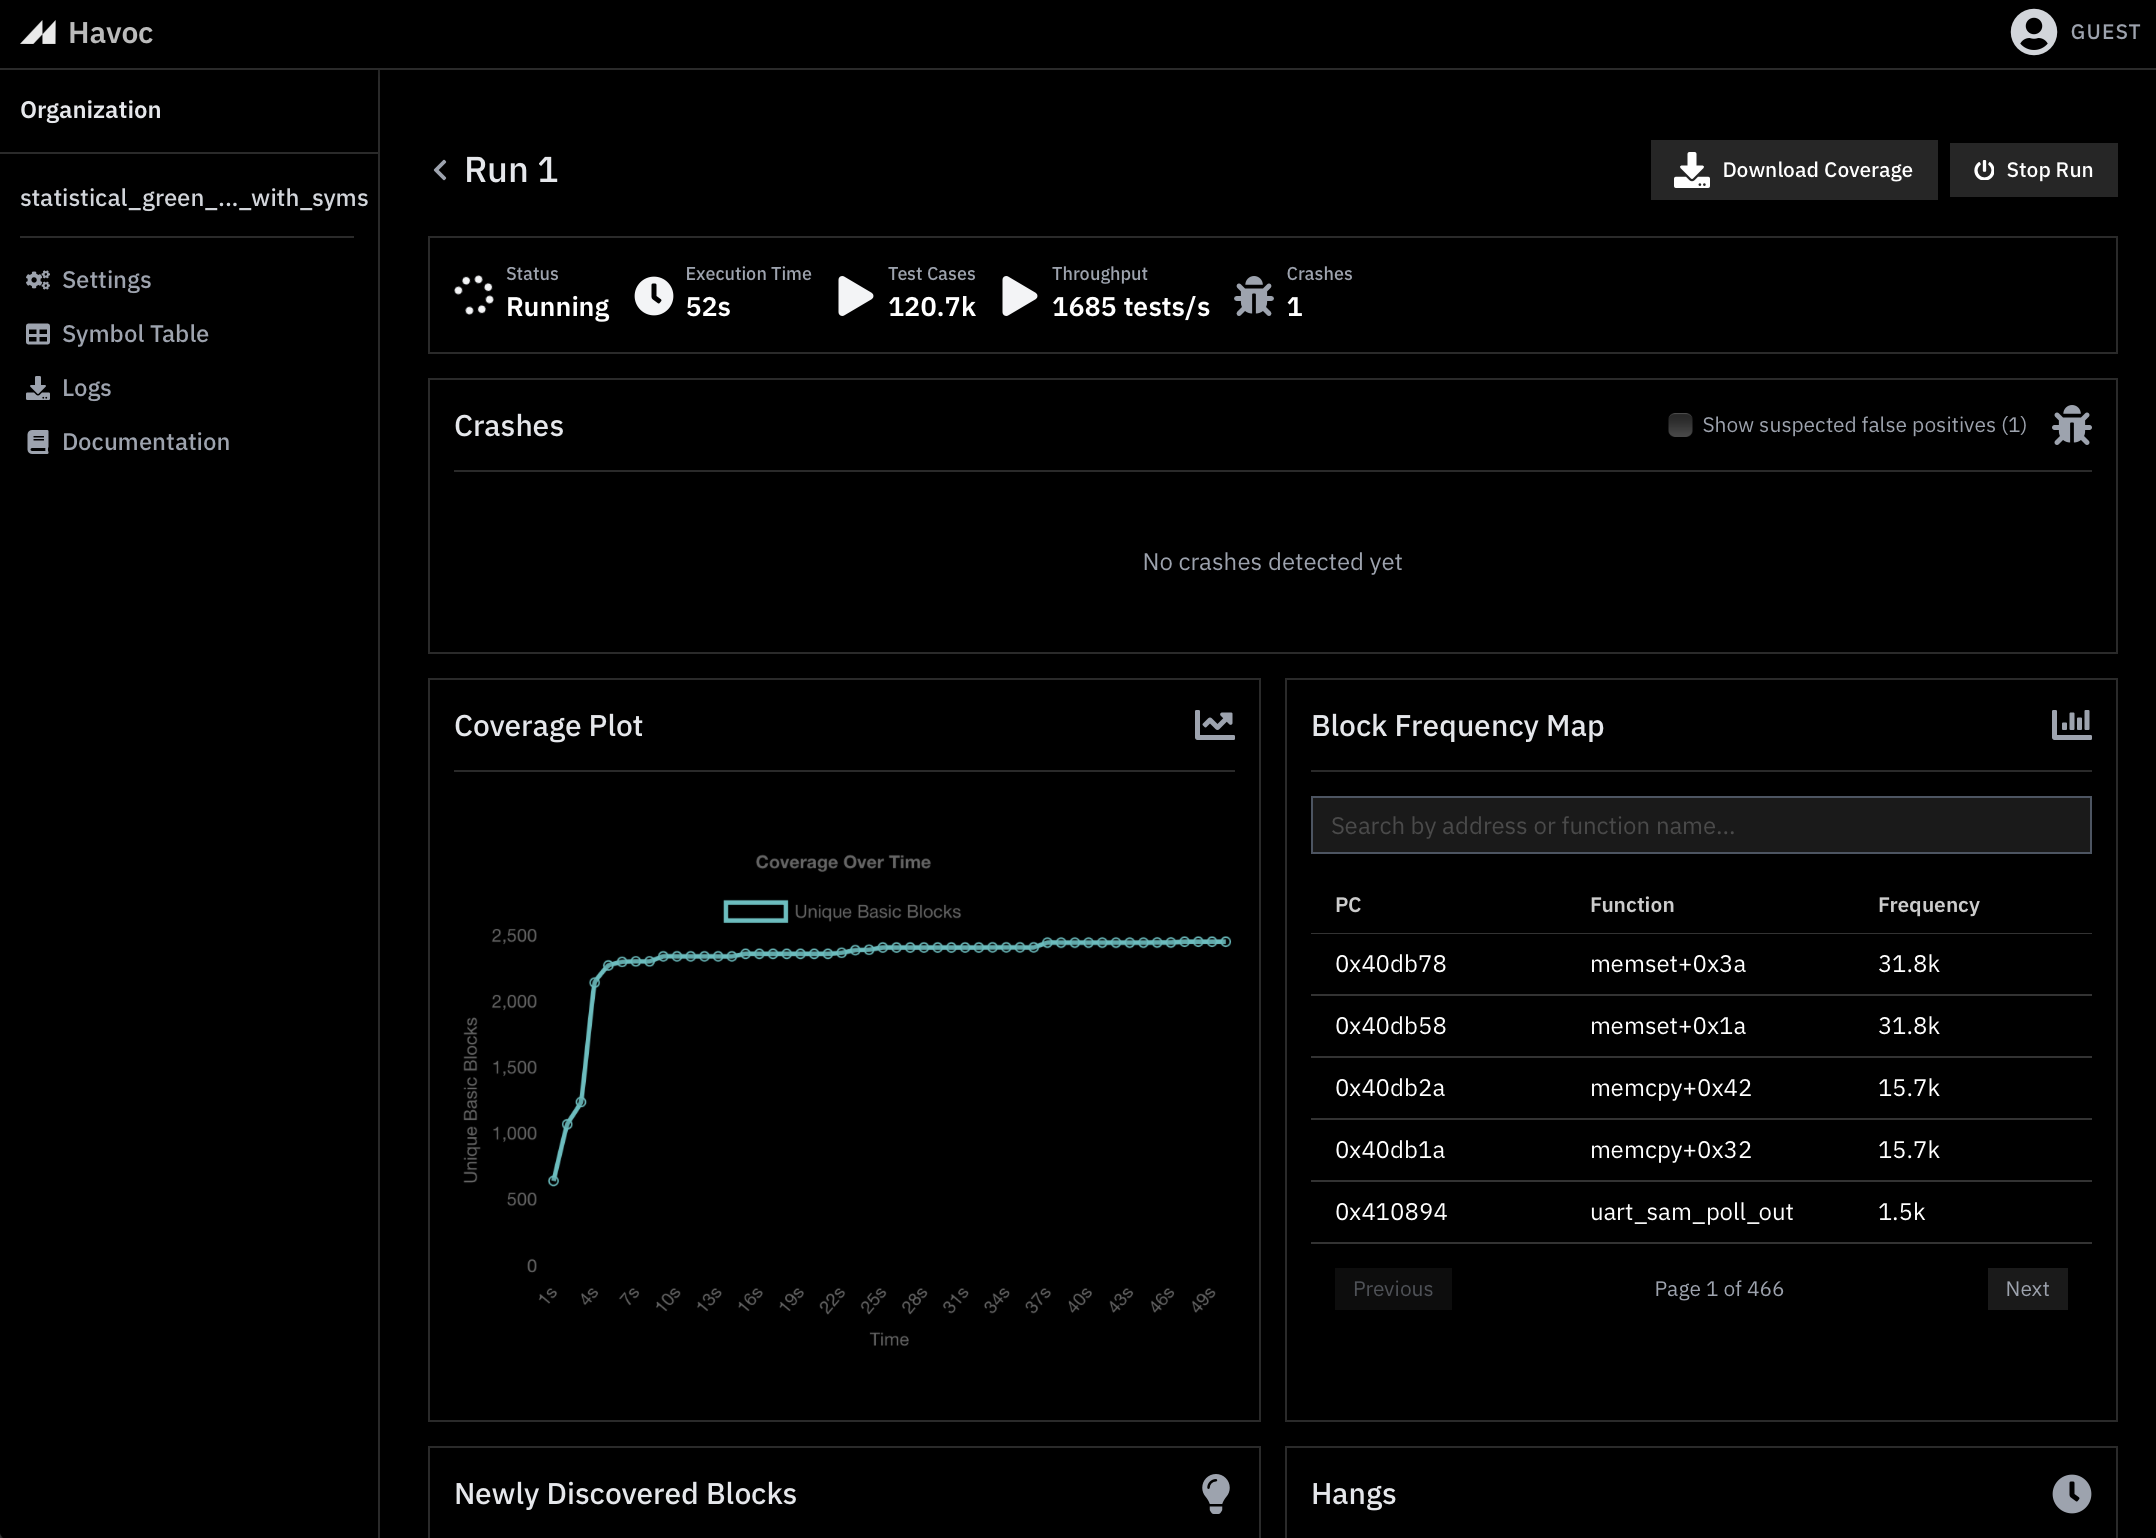
Select the newly created run to open a live view of the fuzzing session:
Sections Explained
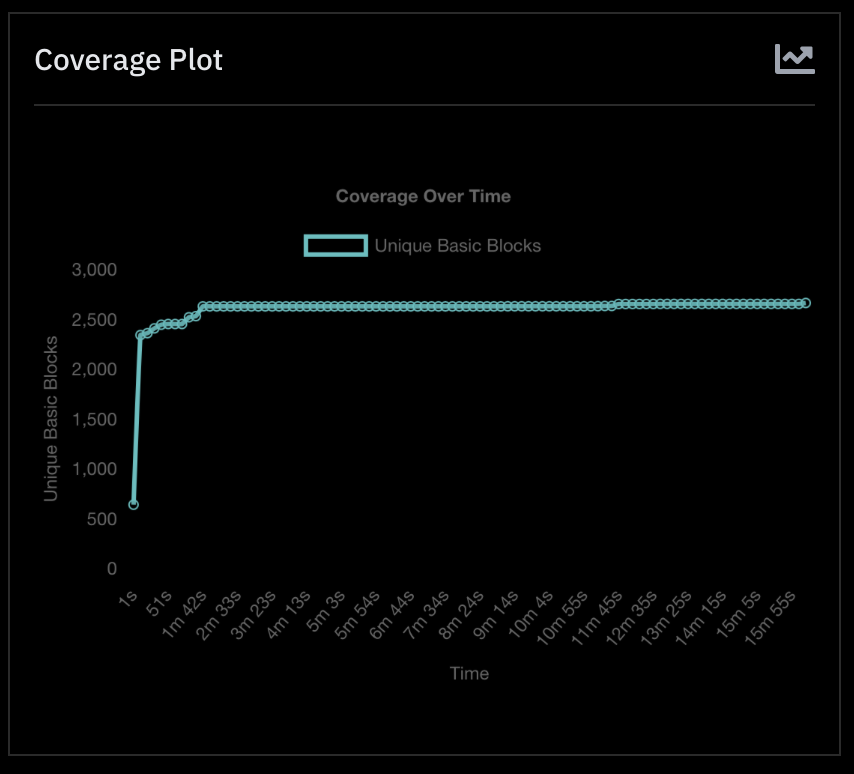
Block Coverage Visualization
Block coverage correlates with code coverage and is a useful measure of the fuzzer’s ability to penetrate the firmware.
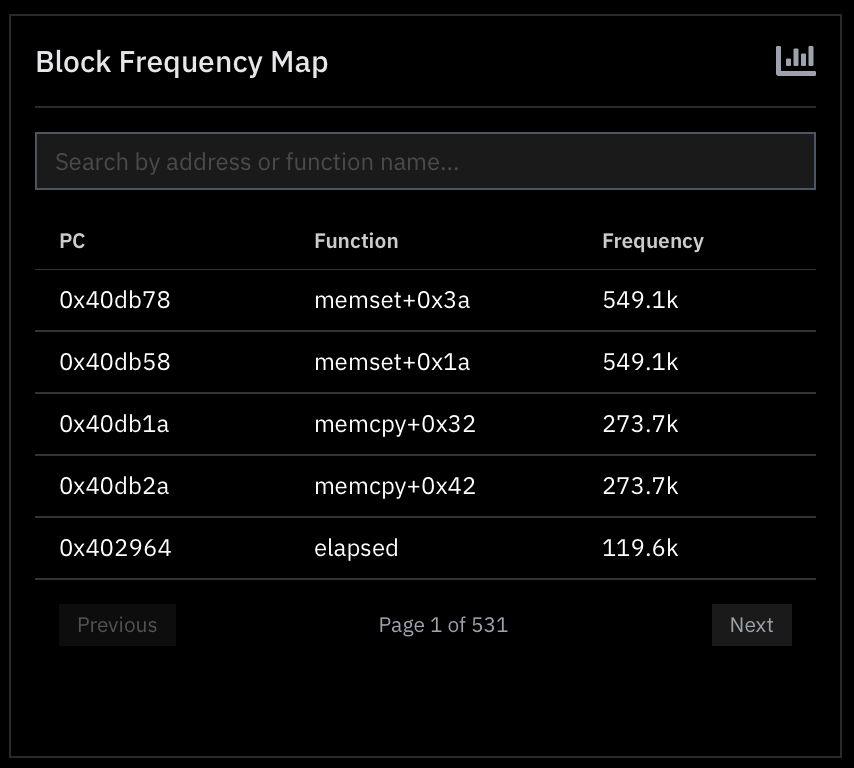
Block Frequency Map
This table displays how much compute time is being spent on each block in within your firmware in decreasing order of frequency. This can be helpful for example to identify functions that are irrelevant to our fuzzing campaign taking up a lot of compute or blocking progress altogether.
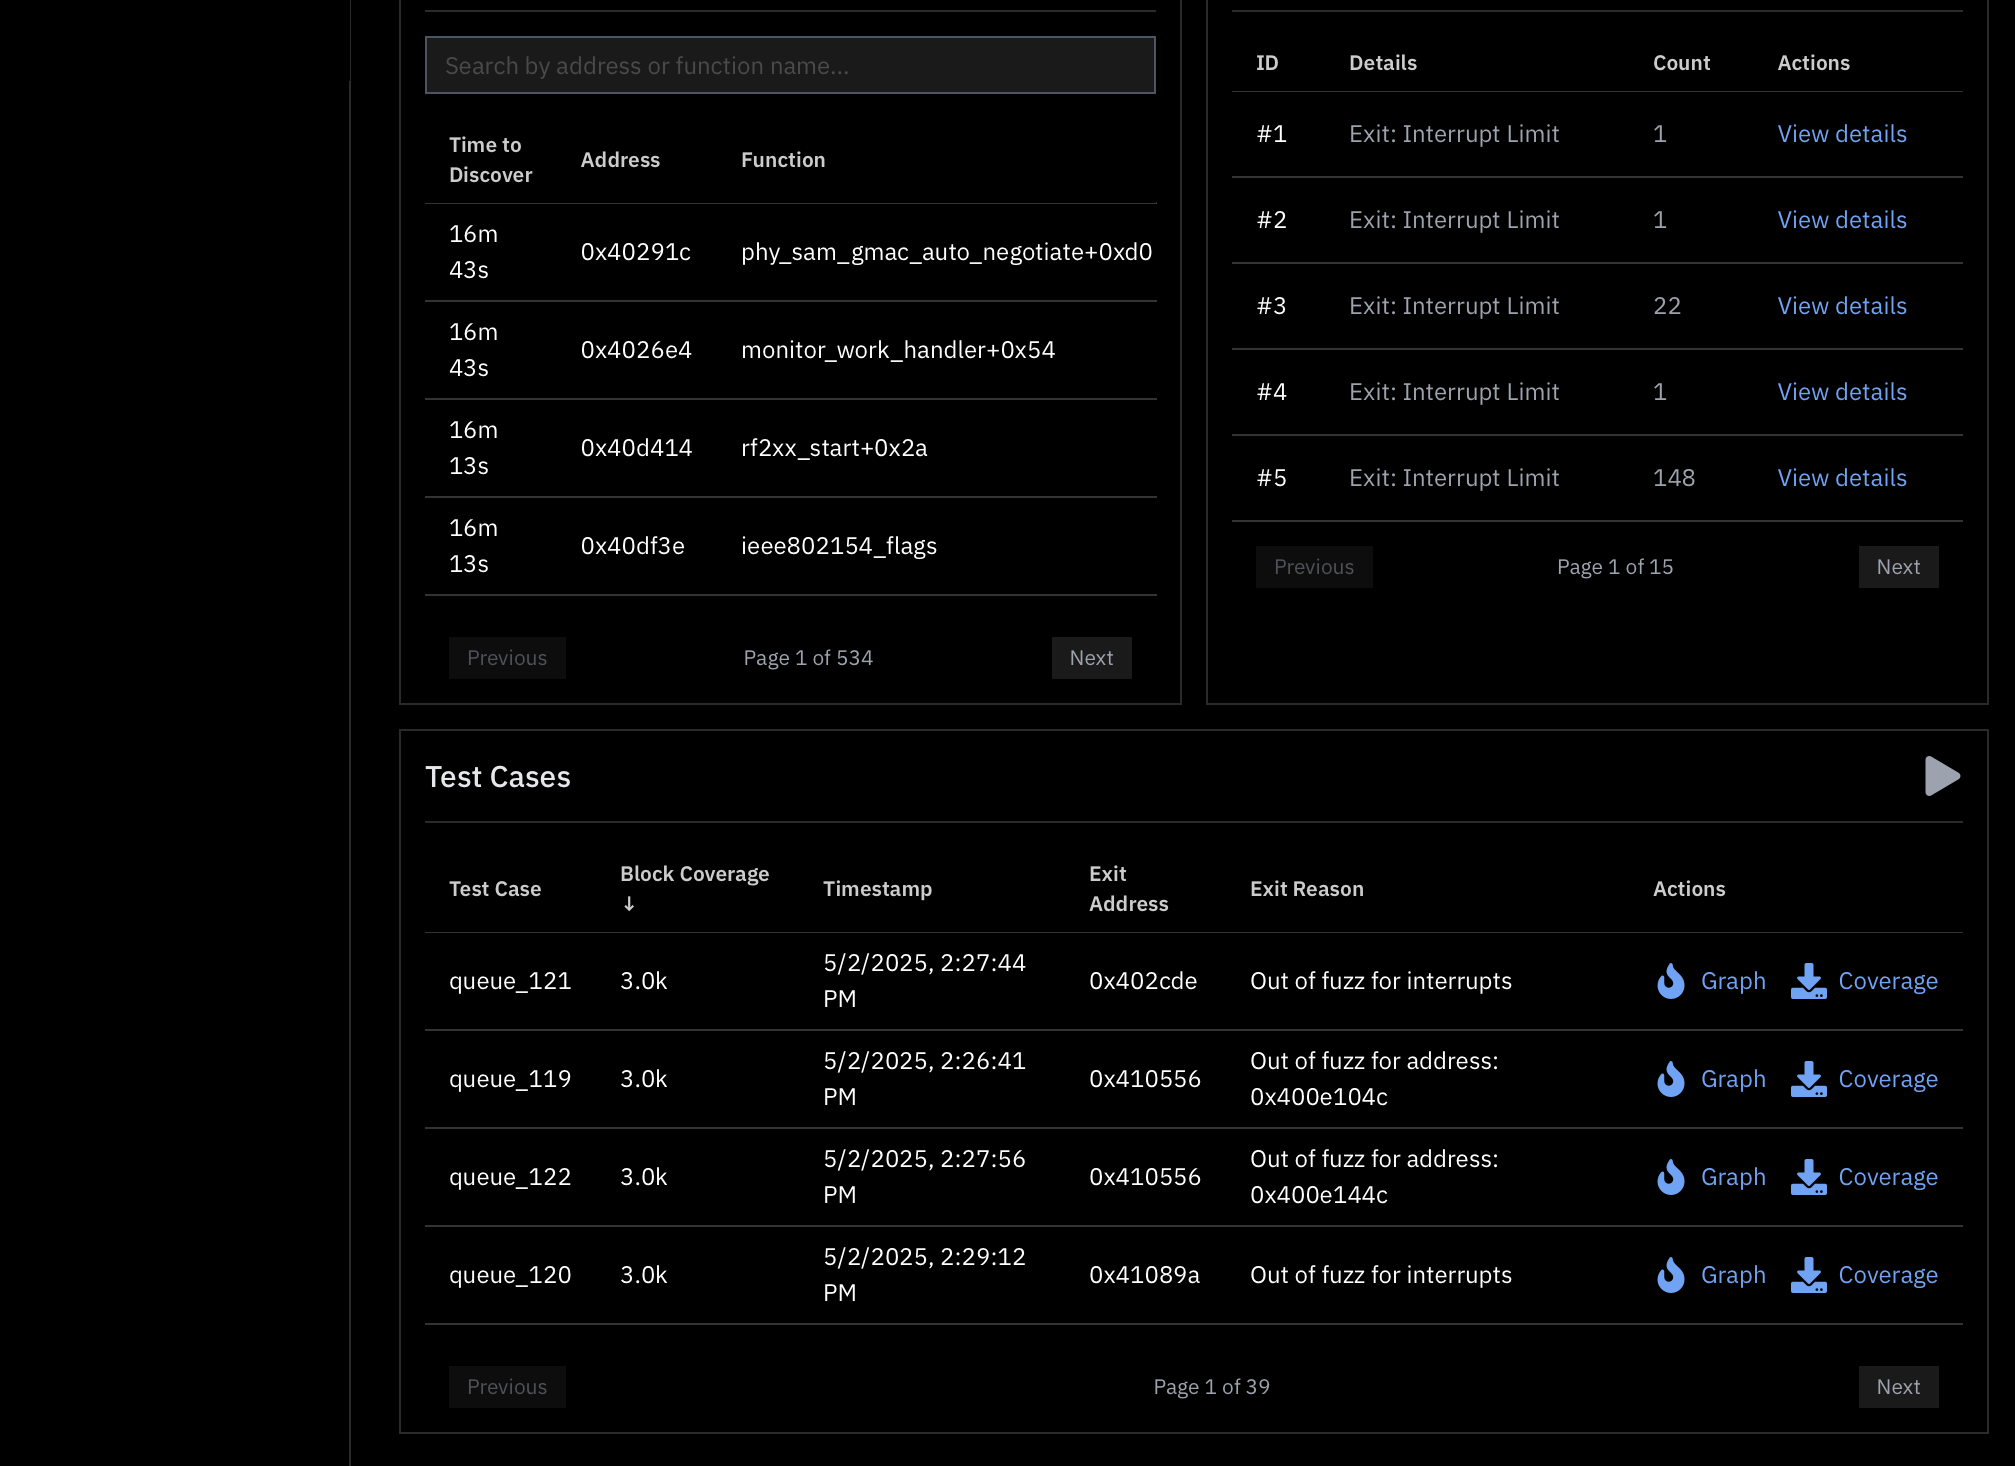
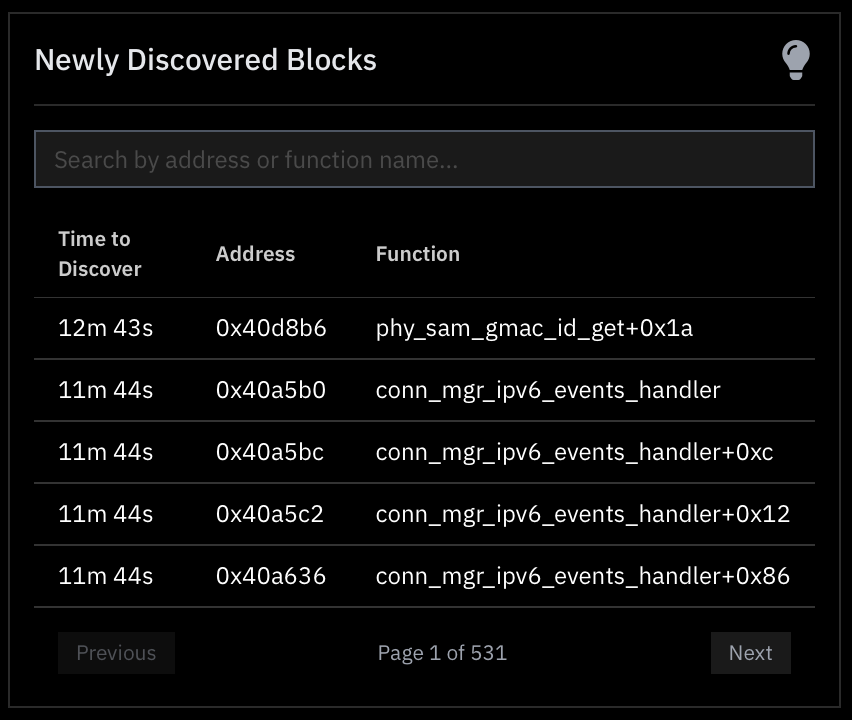
Newly discovered blocks
As the fuzzer reaches new code (units here are “blocks”), updates are provided in real time to the user interface in the form of “Newly Discovered Blocks”. This table is sorted by recency, meaning the newest blocks will always show up at the top.
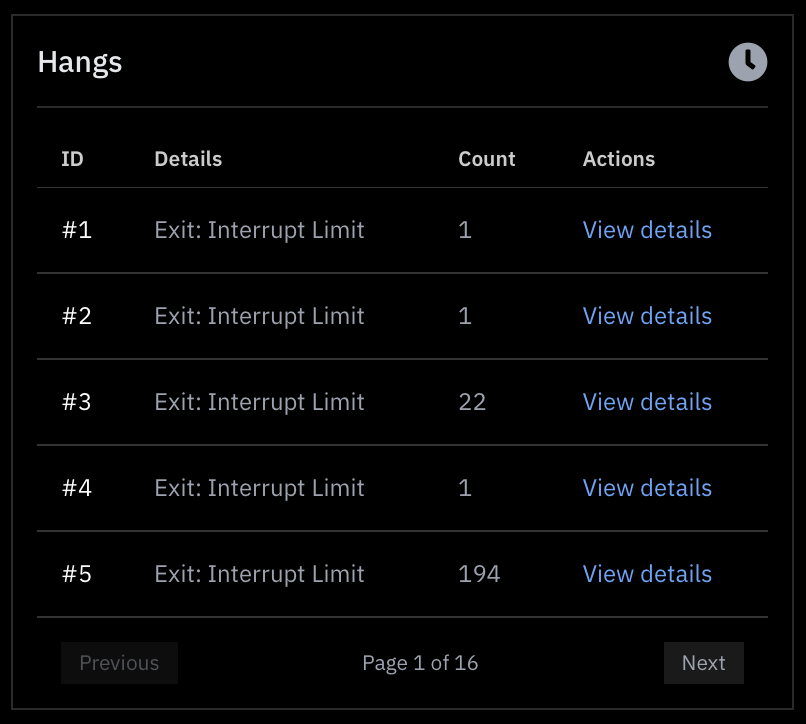
Hangs
Firmware inherently runs in a loop. As a result, the fuzzer needs to decide when to terminate execution of firmware to be able to exercise many test cases per second. Hangs are deliberate terminations of the firmware when a hard-limit or an uninteresting state is reached.
Specifically, you will see hangs when:
- The maximum number of interrupts has been asserted.
- The frequency of interrupts influences the likelihood of the interrupt limit being hit. This frequency is adjustable from Project Settings.
- The maximum number of executed instructions has been breached for that test case.
- The maximum number of instructions executed without interacting with peripherals has been reached (adjustable from Project Settings). Peripherals are the interface through which the firmware communicates with the outside world. If the firmware ceases to interact with peripherals, that is — by definition — an uninteresting state.