You can download and visualize instruction-level coverage from the fuzzer in BinaryNinja using the Lighthouse plugin or in Ghidra using the Cartographer plugin. This visualization helps pinpoint areas where the fuzzer may be stalling, allowing you to address potential issues through binary patching (see ‣)
There are two levels at which you can visualize coverage:
- At the run level, across ALL test cases produced in a run.
- At the individual test case level, for a particular test case within a run.
Visualizing total run coverage
1. Download the Coverage Data
On the Run Page, click the
Download button within the Coverage section.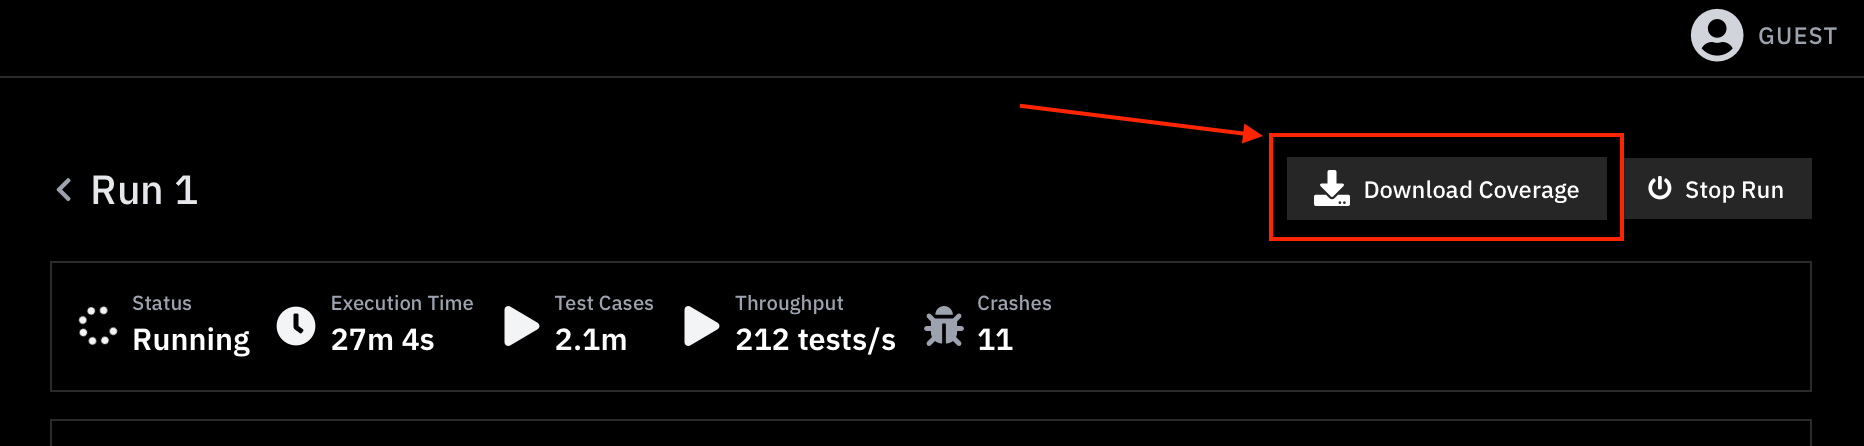
2. Load Coverage in BinaryNinja
Open the firmware under test in BinaryNinja. Then, from the menu, select
Plugins > Lighthouse > Load coverage file... 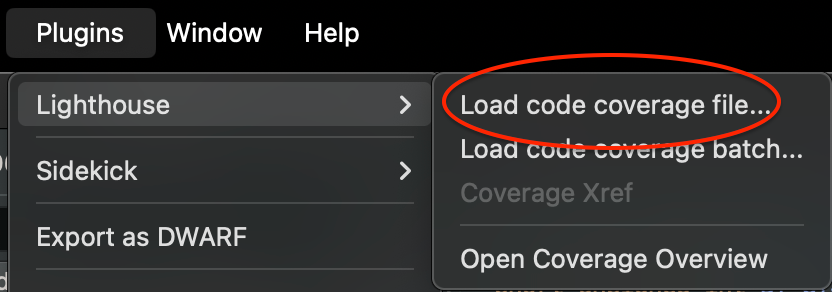
3. Review the Highlighted Coverage
Once loaded, the instructions that were executed will be highlighted within BinaryNinja:
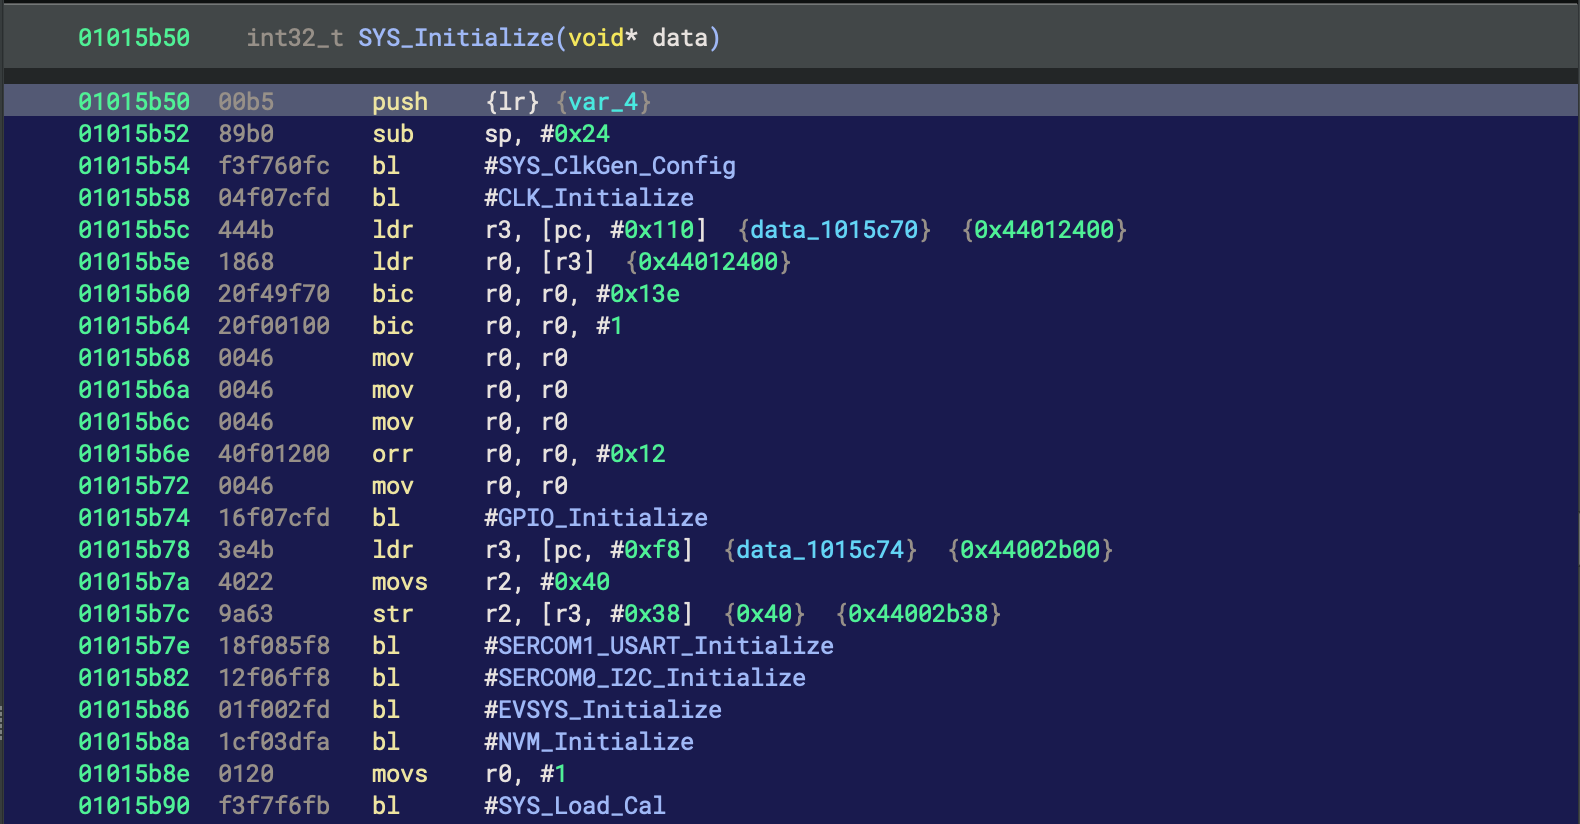
Coverage data is periodically updated by the fuzzer as it traces inputs that trigger new coverage, meaning the file represents a lower-bound approximation of your firmware's instruction-level coverage.
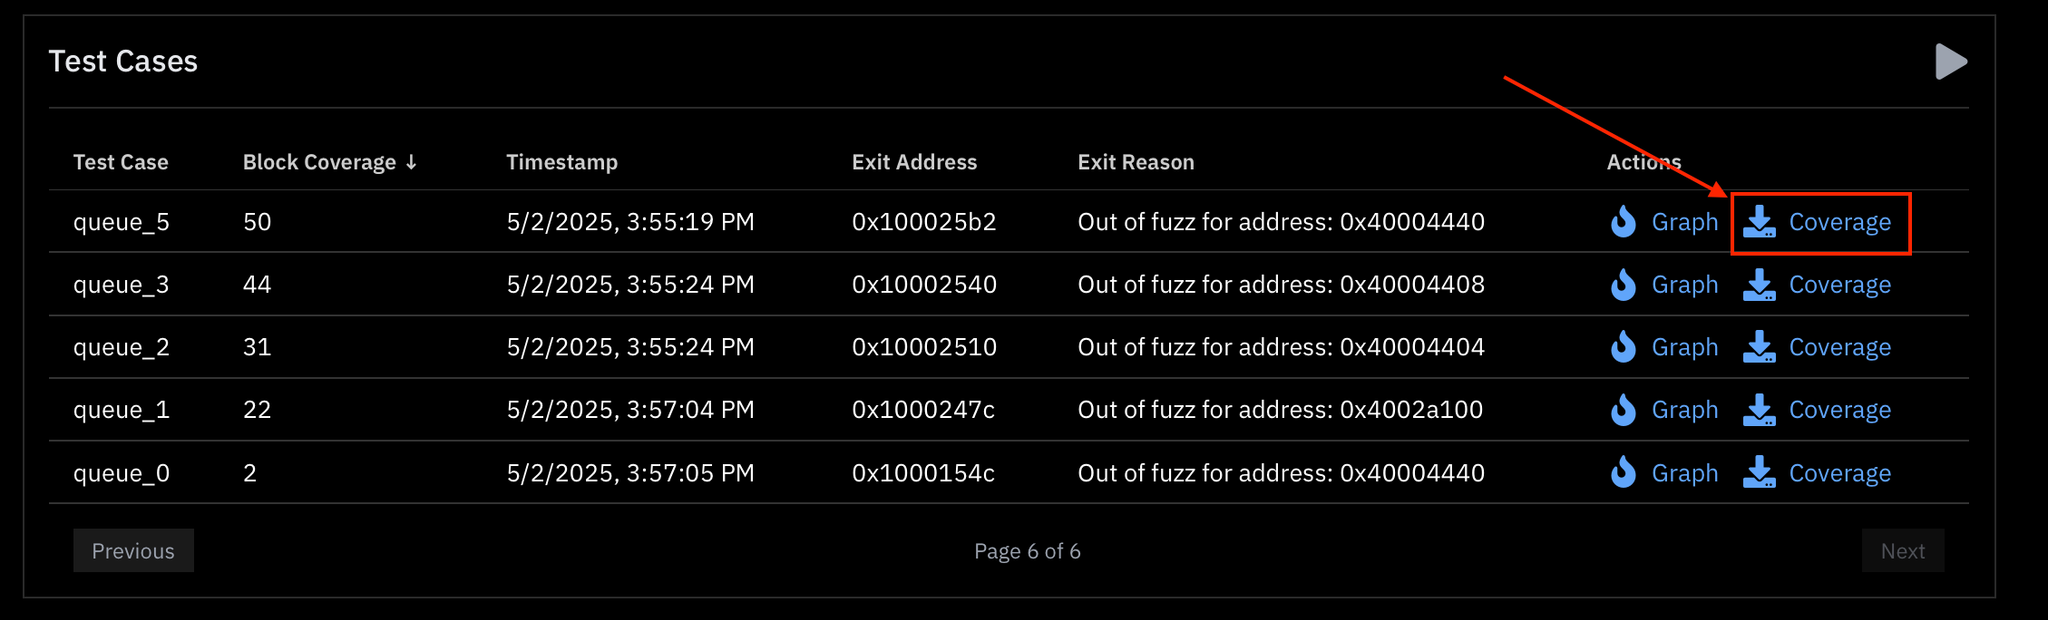
Visualizing individual test case coverage
Same steps as above, except you download the coverage for the test case from the
Test Cases section: